Break-Even Calculator
Calculate the break even point for any product or service and generate a graph with the break-even point. Estimate how many units you need to sell before you cover your fixed and variable costs, and how long it would take.
- Break-even formula
- Basic break-even formula
- Find BEP via the contribution margin
- Break-even point in dollars
- Units to sell to reach profitability
- How to calculate the break-even point
- Break-even analysis example
- Practical application example
Break-even formula
When operating a business, one of the most important analytical tools you will come to use is the break-even analysis. The B/E point is a metric that shows you how much sales you need to reach before you begin realizing profit. In other words, it is the moment when you reach enough revenue to cover your total costs. [1]
Our break-even calculator is a useful tool to refer to when determining prices for the goods and services you offer, deciding on budgets or simply working on a business plan. It will generate a break-even point chart based on the inputs.
A break-even analysis relies on three crucial aspects of a business operation – selling price of a unit, fixed costs and variable costs. Your fixed costs are not influenced by the amounts you sell. Rent is a fixed cost, unless you need to expand operations. Variable costs are largely dependent on the volume of work at hand – more labor and materials would be needed to produce more items, resulting in an increase in expenses.
Basic break-even formula
Having information about all three of these aspects, you can calculate your break-even point (BEP) using the formula:
Break-even measured in units = Total fixed costs / (Selling price of a unit – Variable costs per unit).
In this case, you estimate how many units you need to sell before having actual profit. The fixed costs are a total of all FC, whereas the price and variable costs are measured per unit.
Find BEP via the contribution margin
To calculate your break-even point as a monetary value, use:
Break-even measured in $ = Total fixed costs / Contribution margin ratio,
where the contribution margin ratio is equal to the contribution margin divided by the revenue.
Break-even point in dollars
Another way to estimate it is as such:
Break-even measured in $ = Selling price of a unit x Break-even point in units.
Units to sell to reach profitability
This formula helps you calculate how many units you have to sell in order to reach a desired profit:
Number of units sold = Desired profit / Contribution margin per unit + Break-even point measured in units.
This is a step further from the base calculations, but having done the math on BEP one can move on to more complex estimates. These formulas for number of units, revenue, margin, and markup are all used our break-even calculator.
How to calculate the break-even point
No matter whether you are a business owner, accountant, entrepreneur or even a marketing specialist – you will often need to compute this metric, which is why our break even calculator is so handy. All you need to do is provide information about your fixed costs, cost per unit, and revenue per unit. To make the analysis output time to achieve profitability just input how many units you expect to sell per month.
The algorithm automatically calculates your profit margin, markup, and your break-even point both in terms of units sold and as revenue. If you have specified your sales expectations, you will even see how much time it will take to reach the BEP.
Calculating the break-even point helps you determine how much you will have to sell before you can make profit. Knowing this, you can then regulate your marketing activity if you decide your sales are lower than expected, or just wish to reach the target sooner. This analysis can also serve as a much needed advisor on cutting costs and fixing selling prices. It makes the difference between operating at a loss and achieving financial goals and expanding production.
Break-even analysis example
Using a graphical representation of the quantities involved is extremely helpful, which is why our calculator includes a chart. Let us analyze one such chart for an imaginary firm producing goods which cost $10 per unit. It is selling them for $14 a piece and has fixed operational expenses of $100,000 per year (load example):
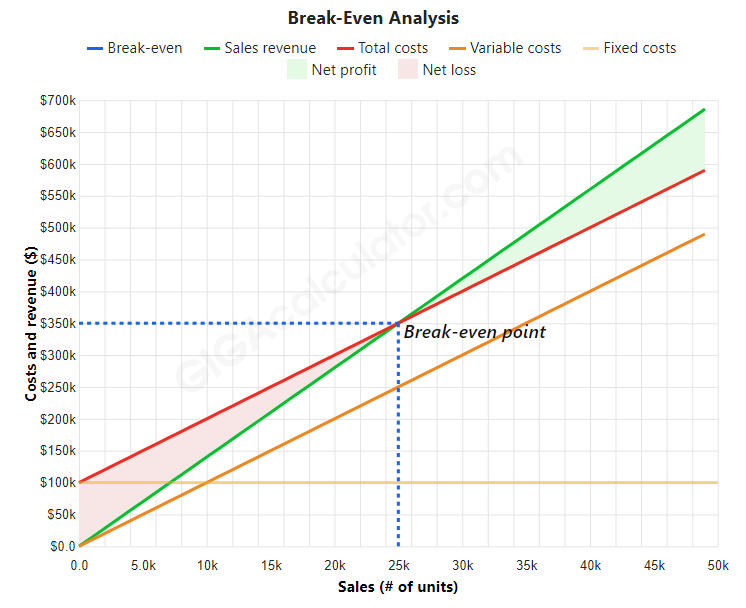
In the graph above:
- Total sales revenue, the total costs, the fixed costs and the variable costs are plotted.
- The green area shows unit sales which result in net profit
- The red area corresponds to unit sales which result in net loss
- The net profit or loss is the dollar difference between the green line and the red line.
- The break-even point is where the red line (costs) crosses the green line (revenue)
Selling more units than what is required to break even provides a margin of safety. It can be expressed in terms of unit sales or sales revenue and results. In the above example, if the company sold 40,000 units instead of 25,000 it would result in a revenue of 40,000 · $14 = $560,000 at a cost of 40,000 · $10 = $400,000 resulting in a net profit of $560,000 - $400,000 = $160,000. These 160 thousand dollars represent the safety margin as well as the net operating profit of the business.
Practical application example
Let us go through an analysis step by step to illustrate its usefulness in a real-life example of starting a business.
Michael is the owner of a brand new pizza shop. He is uncertain whether his venture will be successful and wants to know how long until it is profitable. He has estimated his total fixed costs amount to $10,000, while the variable cost per unit is $2.50. He sells a slice of pizza for $3.90. From this we can calculate:
The break-even point measured in pizza slices sold = 10,000 / (3.90 – 2.50) = 10,000 / 1.4 = 2,564.
It looks like Michael will have to sell 2,564 slices before he can cover his expenses and start profiting from his business. In dollars that is: 3.90 x 2,564 = $9,999.6
Michael now knows that he needs to sell about $10,000 in pizza slices before he can realize a profit for himself. At that point his revenue outpaces the combined value of his fixed and variable costs.
References
1Levine D., Boldrin M. (2008). "Against Intellectual Monopoly". Cambridge University Press.
Cite this calculator & page
Cite results from this online calculator or information on this page by choosing a citation format:
Georgiev, G.Z. (n.d.). Break-Even Calculator. GIGAcalculator.com. Retrieved Jul 01, 2026, from https://www.gigacalculator.com/calculators/break-even-calculator.php