Standard Deviation Calculator
Easily calculate the standard deviation of a sample or estimate a population standard deviation based on a random sample from it. SD calculation for binomial data or continuous data. The calculator also outputs the variance, arithmetic mean (average), range, count, and standard error of the mean (SEM).
- What is standard deviation
- How to calculate standard deviation
- Standard deviation formula
- Estimating standard deviation from a sample
- Population standard deviation
- Standard deviation for binomial data
- How to interpret the standard deviation
- Practical applications and examples
What is standard deviation
Standard deviation is a term in statistics and probability theory used to quantify the amount of dispersion in a numerical data set. It is a descriptive statistic showing how far from the normal (expected, average) the data points of interest are, which can lead to valuable insight.
"Standard deviation" is often concatenated to SD or StDev and is denoted by the Greek letter sigma σ when referencing a population estimate based on a sample and the small Latin letter s when referencing sample standard deviation which is directly calculated.
A low standard deviation σ means that the data points are clustered around the sample mean while a high SD indicates that the set of data is spread over a wide range of values. The graph below illustrates the point by comparing two distributions of 18 elements each, with different standard deviations (2.26 and 8.94):
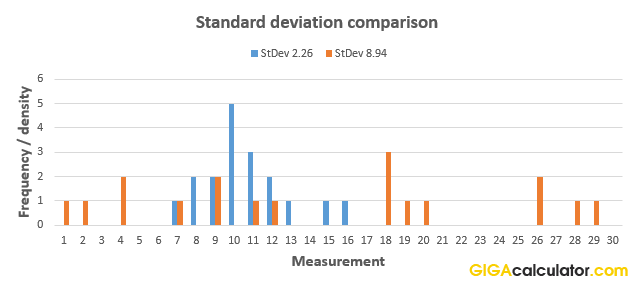
Check the numbers in the example data sets and the calculation results in our SD calculator here for set 1 and here for set 2.
How to calculate standard deviation
Standard deviation is calculated as the square root of the variance, while the variance itself is the average of the squared differences from the arithmetic mean. We square the differences so that larger departures from the mean are punished more severely, and it also has the side effect of treating departures in both directions (positive errors and negative errors) equally. The standard deviation is preferred over the variance when describing statistical data since it is expressed in the same unit as the values in the data. Our stdev calculator also calculates the variance for you.
For continuous outcome variables you need the whole raw dataset. For binomial data such as proportions, conversion rates, recovery rates, survival rates, etc. a standard deviation calculator can calculate the variance and standard deviation. It is done using just two summary statistics: the number of observations (sample size) and the rate of events of interest (which is also a mean). Our calculator supports both continuous and binomial data. Equations for calculating standard deviation are presented below.
Standard deviation formula
There are two formulas one can use, depending on whether the standard deviation calculation is based on a sample from a population, or if it is for a data set covering the entire population.
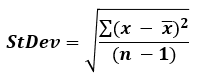
To find the standard deviation from a sample, the sample SD formula applies, which is:
If the data set represents the whole population of interest, use this formula to find the standard deviation:
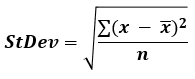
In the population standard deviation formula above, x is a data point, x (read "x bar") is the arithmetic mean, and n is the number of elements in the data set (count of values). The summation is for the standard i=1 to i=n sum. As noted, in both cases the standard deviation is equal to the square root of the variance. Our standard deviation calculator supports both formulas with the flip of a switch.
Estimating standard deviation from a sample
Most practical cases call for using the sample standard deviation formula since most of the time one is sampling from a population and does not have access to data about the whole population. The formula our calculator uses in this case is known as the "corrected sample standard deviation". It is not unique as unlike the sample mean and variance, there is no single formula that is an optimal estimator across all distributions. This formula, for example, can be heavily biased for n < 10.
Population standard deviation
In certain cases, you will have information about the whole population, for example if the population of interest is students in a class or a school, at a given time, it is possible to have the grades for all of them. However, most often the population of interest will span across time and cover too many individuals to be practically measured.
Standard deviation for binomial data
If you need to calculate the standard deviation for proportions, event rates, etc. the formula is simply:
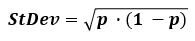
where p is the proportion of the population that experiences the event of interest, or has a characteristic of interest. Since a proportion is just a special type of mean, this standard deviation formula is derived through a simple transformation of the above ones. Our standard deviation calculator supports proportions for which only the sample size and the event rate need to be known to estimate the difference between the observed outcome and the expected one.
How to interpret the standard deviation
As shown in the example above, a lower standard deviation means lower dispersion in a data set. This means the numbers are more clustered around the mean. This makes the standard deviation an excellent choice to describe the precision of measuring tools or instruments, as well as procedures in physics, medicine, biology, physiology, chemistry, and so on. It can be thought of as a measurement of uncertainty in the data - expected, known or accepted, depending on context.
In many situations a statistical cut-off point is expressed in number of standard deviations from a normal distribution. Using the normal cumulative distribution function it is easy to convert standard deviations to percentiles. This answers the question what percentage of cases lie x standards deviations from the expected value. Here are some key levels and percentile cut-offs:
Table of commonly used SD cut-offs for normally distributed variables:
| Standard deviation | Percentile (1-sided) | Percentile (2-sided) |
|---|---|---|
| 0.3186σ | 50.00% | 25.00% |
| 0.5000σ | 69.15% | 38.29% |
| 0.6745σ | 75.00% | 50.00% |
| 0.8416σ | 80.00% | 60.00% |
| 1.0000σ | 84.13% | 68.27% |
| 1.2816σ | 90.00% | 80.00% |
| 1.6448σ | 95.00% | 90.00% |
| 1.9599σ | 97.50% | 95.00% |
| 2.3263σ | 99.00% | 98.00% |
| 2.5758σ | 99.50% | 99.00% |
| 3.7190σ | 99.99% | 99.98% |
So, if an observation is 1.645 standard deviations from the expected value, it is in the top 10-th percentile of the population of interest. 2-sided refers to the direction of the effect you are interested in. In most practical scenarios the 1-sided number is the relevant one. In population studies, the 2-sided percentile is equivalent to the proportion within the bound specified by the standard deviation.
A geometrical interpretation would be that the standard deviation represents the portion of the area of a distribution that is included or excluded.
Practical applications and examples
Standard deviations have an array of practical uses, most notably linked to statistics and measurements, which is why this online tool is in our "Statistics" category. In education it is common to calculate the standard deviation of students' test scores.
Statistical inference
In statistical inference through null-hypothesis statistical tests the procedure is to establish what the expected distribution of outcomes from a test is, assuming a set of conditions are true. Then the observed data is converted to standard deviation measures and compared to that expected outcome. If the observed experimental data departs significantly from the expectation, there may be ground for inferring a breakthrough. Such results are often called "statistically significant". In statistical inference one deals with samples from a population, hence the sample standard deviation formula needs to be applied in order to estimate the population standard deviation.
Different practical situations require different thresholds (levels of statistical significance), which can be expressed in terms of standard deviations. For example, 2 standard deviations from the expected value. Alternatively, it could be expressed as the probability of the observation under the null such as 5%, 1%, etc. A value which is calculated as 1.96 SD from the null cutoff will only be seen 5% of the time if the null hypothesis is in fact true. The number of standard deviations of an observation is often referred to as the Z-score. The experiments in CERN through which gravitational waves were discovered, for example, had a threshold of 6-sigma. The observations from the experiment had to be extremely unlikely before a discovery was to be announced.
One reason the standard deviation of the mean (standard error of the mean, SEM) is the statistic of choice is that it is usually normally distributed, even if the underlying raw data is not. Thus, very often it is the mean of the experimental data which is compared to the expected mean and standard deviation of the mean, not individual data points.
Finance
Standard deviation of the price fluctuations of a financial asset (stock, bond, property, etc.) is widely used to estimate the amount of risk of single assets or whole investment portfolios by financial managers and academic papers. This is, however, a hotly debated issue with many prominent financial practitioners denouncing the equation of risk and standard deviation. A popular technical analysis tool - the Bollinger Bands, is effectively plotting lines calculated so that they are two standard deviations in either direction from the mean price of a given rolling period.
Since standard deviation and other statistical tools only apply to stationary series, and some financial data is non-stationary, it needs to be transformed by removing trend, seasonality, and auto-correlation from the dataset. Usually this is done by differencing using complex regressions like ARIMA (AutoRegressive Integrated Moving Average) and exponential smoothing models.
Weather
Standard deviation calculations often accompany climate data like mean daily maximum and minimum temperatures, as they help us understand how often and by how much they fluctuate. For example, coastal locations often have smaller temperature deviations when compared to inland locations, making the typical weather quite different, even if they have the same average temperature.
References
1Spanos A. (2019). "Probability Theory and Statistical Inference". Cambridge University Press. pp. 396-404, doi: 10.1017/9781316882825
Cite this calculator & page
Cite results from this online calculator or information on this page by choosing a citation format:
Georgiev, G.Z. (n.d.). Standard Deviation Calculator. GIGAcalculator.com. Retrieved Jul 30, 2026, from https://www.gigacalculator.com/calculators/standard-deviation-calculator.php
The author of this tool
 Georgi Georgiev is an applied statistician with background in statistical analysis of online controlled experiments, including developing statistical software, writing over one hundred articles and papers, as well as the influential book "Statistical Methods in Online A/B Testing".