In this article we will talk about CAGR (Compound Annual Growth Rate) in detail. The formula for calculating it is presented in detail with examples. It also covers how to calculate it in Excel, how to interpret it, its utility in assessing financial assets, making predictions, and more.
- What does CAGR stand for?
- What is Compound Annual Growth Rate?
- Main uses
- CAGR calculation formula
- CAGR calculation in Excel
- How to use a CAGR calculator
- Comparing investments using CAGR
- Financial forecasting using CAGR
- Does CAGR account for risk?
- Limitations of CAGR
- CAGR versus IRR
- Non-traditional uses
What does CAGR stand for?
As hinted by the title, the acronym CAGR means ‘Compound Annual Growth Rate’. Such a rate can be computed for anything, but the term is mostly used in relation to returns from financial assets and investment strategies.
What is Compound Annual Growth Rate?
In finance, CAGR is the average annual rate of increase in the value of an asset or investment. It can be useful for tracking business performance in things like sales, revenue, clients, users, units produced or delivered, etc..
Understanding Compound Annual Growth Rate is easier if we break it down to its components:
- ‘Rate‘ indicates that we are dealing with a ratio – the relationship between one thing and another.
- ‘Growth‘ refers to the relationship between an initial time and an end time. The rate is therefore the ratio between a value from one point in time to another.
- ‘Annual‘ refers to the length of each period – a year.
- ‘Compound‘ has the same meaning as in ‘compound interest rate‘. It refers to the fact that we need to account for multiple parts, in this case the multiple year-over-year ratios.
CAGR is the average rate at which an asset grows in value over a specified number of years. When used predictively, it can be viewed as a constant rate required to reach a particular outcome.
Main uses
A growth rate of any kind is useful in comparing separate data sets belonging to a common domain. For example, one can compare the revenue growth of companies in a particular industry versus another, or to a different industry entirely. Applied for individual companies, it is often used to examine the rate of change in company revenue, cash flows, stock price, and others.
A corporate accountant or financial adviser might compare the rate of growth of company divisions within the same enterprise. It can be used to assess past investment performance or predict expected average future performance, as well as to compare different investments.
CAGR formula
The following mathematical equation is how to calculate the Compound Annual Growth Rate of any asset:

In the formula above V(t0) is the initial value of the asset, V(tn) is the end value, tn is the end period, and t0 is the initial period (first year). The difference tn – t0 is the number of time periods over which the growth has been realized. For CAGR that is in years, but the same growth rate formula can be used with months, quarters, etc. to calculate the respective growth rate.
This is nothing other than the geometric mean of the growth rate of all year over year comparisons for the specified period.
Example calculation:
For example, one can calculate the CAGR of a real estate investment over a period of 5 years. If the purchase value of the home or business property is $1 million USD and its estimated value after 5 years is $1.2 million USD, then:
CAGR(0,5) = (1.2 / 1) ^ (1/5) – 1 = 1.2 ^ 1/5 – 1 = 1.037137 – 1 = 0.0371
CAGR is usually presented as a percentage. To convert the above to a percentage we need to simply multiply it by 100 and add the percent sign, like so:
CAGR(%) = 0.037 * 100% = 3.71%
So, the Compound Annual Growth Rate is 3.71% over this 5-year investment period.
Calculating CAGR with a partial year
In reality investments often end up being liquidated without regard for periodicity. Say one holds an investment in vacation rentals, a shipping company, or perhaps an entertainment corporation for 10 years. It is then liquidated 100 days into the 11-th year. How do you calculate CAGR in this case?
First, compute what part of the year those 100 days represent. To do that, divide 100 by 365 to get 0.274. Now add 0.274 to 10 and you have the difference tn – t0 . The rest of the formula remains the same.
The same logic applies if you need to calculate a quarterly or monthly growth rate, but instead of 365 you need to divide by 30.5 and 7, respectively.
How to calculate CAGR in Excel?
In newer versions of Excel (some 2013 versions, all versions newer than 2019), including Office 365 there is a neat function to compute CAGR called RRI. It takes only three parameters as input:
RRI(Nper, Pv, Fv)
and returns an equivalent average interest rate for the growth of an investment for the number of time periods (Nper) and the given present value (Pv) and future value of an asset (Fv). This is exactly the compound annual growth rate.
Using the above example, we can substitute the values: Nper with 5, Pv with 1 million and Fv with 1.2 million, and we get the exact same output from Excel’s RRI function:
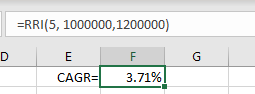
If you have an older version of MS Excel, then a bit of coding would be required to implement the formula.
How to use a CAGR calculator
Using an online CAGR calculator is a great substitute for when you’re on the road or just want a convenient tool handy. You don’t need to remember the CAGR equation in Excel with its awkwardly named variables which are difficult to recall. Using a calculator works in a straightforward manner as it only has three inputs, just like the formula.
All you need to know is the value of the investment / asset at the initial period, at the end period, and the number of periods to compound over. In this case that would be the number of years.
GIGAcalculator’s online tool automatically outputs the total growth as well. This is helpful in applications in which you must also present the total absolute return or calculate the total rate of return. This often happens when assessing the performance of a stock market or bond market portfolio, or a personal savings plan.
Comparing investments using CAGR
One of the most common uses for CAGR is for comparing proposed investment options or strategies, be it in single assets or in portfolios. The growth rate of different mutual funds or hedge funds can be compared as a filter for choosing an investment vehicle. It is useful as a first-pass check on the viability of an offer.
Note that while CAGR may sound like an accounting term, it is not one. Thus it is not checked and audited the same way as accounting data.
For example, one may want to compare a savings account to a more active investment strategy such as investments in high-tech companies (e.g. telecommunications, AI, biochemistry, genomics, material design), or developing markets, or any other niche. A higher CAGR for the active strategy would indicate a higher average rate of growth for the initial investment. A lower value indicates the inverse.
An average growth rate should never be the sole factor for judging an investment as good or bad. Many factors contribute to what can be a good investment, and likewise for what may be a horrible one. Having some sort of insurance or hedge is recommended regardless of how good the endeavor looks on paper.

Financial forecasting using CAGR
A compound annual growth rate can be used for forecasting of average expected financial returns. To do so, just replace the end value of the asset with a future value from a prediction. Note that extrapolation from historical growth will rarely be a useful prediction since past performance may not be indicative of future performance. Different forces dampening or stimulating growth should be taken into account by an informed analyst.
Other than that, forecasting future growth using CAGR is straightforward insofar as the formula remains the same. All the usual limitations and caveats of the metric remain in force (as mentioned below).
For example, it is useful in understanding if you can reach a given investment goal. An example would be getting enough money in a college education fund by the time your kid is of college-age. A $10,000 investment in with an expected CAGR of just 5% will not cut it if you need to have $100,000 in the bank after just 15 years. An unrealistically high 16% rate of return would be required, so it would be wise to increase the initial investment.
Does CAGR account for risk?
Risk is equated to volatility and/or some measure of minimum or maximum value of an investment over a given period of time such as maximum drawdown. CAGR does not assess financial risk or investment risk in this sense since assets with very different price movements may have the same average return. The table below presents an illustrative example.
| Year | Asset #1 | Asset #2 | Asset #3 |
| 0 | $100,000 | $100,000 | $100,000 |
| 1 | $105,000 | $105,000 | $140,000 |
| 2 | $110,000 | $80,000 | $132,000 |
| 3 | $120,000 | $90,000 | $105,000 |
| 4 | $130,000 | $130,000 | $130,000 |
| CAGR | 6.78% | 6.78% | 6.78% |
These three investments have vastly different volatility, but the same average yearly growth rate over four years. Despite having different annual variability (usually measured in terms of standard deviation, stdev), CAGR makes the three assets look exactly the same. Being an idealization of the process which governs how each of the three assets transition from the initial value to their final value, it suffers from loss of information.
The easy comparison of assets based on growth is what makes Compound Annual Growth Rate great for certain purposes, but it also strips it of useful qualities for other purposes such as risk assessment. It is akin to a smoothed average in technical analysis of stocks and commodities as it allows you to see the big picture or trend, but hides the bumps along the road.
Limitations of CAGR
An important practical limitation is that by default CAGR does not account for adding or withdrawing funds from an investment or investment portfolio during the period of interest. Using the beginning and end balances in cases of either fund injections or withdrawals will completely invalidate a CAGR calculation.
This is not exactly a limitation of the metric, but rather of its presentation by some mutual funds, fund managers, and so on. A fund may have had a great run over the past three or five years, and so you would be presented with CAGR for the portfolio performance in just that period of time. As an average it is highly influenced by extreme values so the shorter the period, the more likely that even a single good or bad year would throw the entire indicator off. The established advice is to calculate annual growth rate for as long as there is data, unless a major event makes data prior to it incomparable or unsuitable for use.
Should you use IRR instead of CAGR?
IRR or Internal Rate of Return is another way to measure the return on an asset the value of which is subject to changes. It is often called discounted cash flow rate of return. Similarly to CAGR, IRR does not take into account external factors like capital cost, currency inflation, etc. unless specifically accounted for in the input. Since it works on all yearly returns instead of just the present value and future value of the investment (beginning value and ending value) it results in a more nuanced computation. IRR penalizes higher volatility since it gives more weight to earlier cash flow movements compared to later ones, in line with the time preference of investors.
Historically, the utility of CAGR was the simplicity of its formula and calculation. It also required minimal information to compute it. Nowadays both computations and information are generally not an issue and there are free IRR calculators like ours. Therefore, it is advisable to use IRR instead of CAGR whenever you can since CAGR only assumes a single outflow (investment) and a single inflow (cash out), so it is unsuitable for more complex scenarios. See our detailed comparison of CAGR, IRR, and XIRR.
Non-traditional Uses of Compound Annual Growth Rates
While it is widely recognized as a financial metric, CAGR could also be employed in other fields. For example, a municipality might use it to compute its annual growth rate in terms of number of citizens, number of houses, GDP, and so on. An actor or singer can similarly measure the increase in their following. Politicians may use it to compare how their voter base grows versus that of a competing politician.
Obviously, some of these will be less meaningful than in financial matters, while others may be surprisingly useful, e.g. a census is usually conducted every 10 or so years so CAGR can be used to reconstruct an idealized time series based on it.
Final Words
The Compound Annual Growth Rate is a useful tool for a quick comparison of the average growth rate of different assets and investment opportunities, either historically or in terms of a forecast. However useful its simplicity is for a first assessment, it should never be the single deciding factor in a serious financial or investment advice or system. A CAGR calculation should always be complemented with other measures and assessments.

An applied statistician, data analyst, and developer of statistical software, Georgi has expertise in web analytics, statistics, design of experiments, and business risk management, among others. He covers a variety of topics where mathematical models and statistics are useful and loves to build calculators which solve apply these models in practice. Georgi is also the author of the influential book “Statistical Methods in Online A/B Testing” (2019).