Arithmetic Mean Calculator
Use this average calculator to easily calculate the arithmetic mean, often called an arithmetic average, of a set of numbers. Accepts numbers in a scientific notation (e.g. 2.95E-5).
- What is an arithmetic mean?
- Arithmetic mean formula
- Useful properties of the arithmetic average
- How to not be mislead by averages
- Averaging angles and daytimes
What is an arithmetic mean?
The arithmetic mean is one of the most commonly used statistics. Often called just "average" or "mean", is a descriptive statistic used as a summary measure of an attribute of a sample (dataset). It is calculated by summing up all numbers in a data set, then dividing by the number of data items and is the most readily understood measure of central tendency. The term "average" is sometimes used to describe other statistics, such as the median or the mode, while the term "mean" can refer to other concepts such as the geometric mean or the harmonic mean, which is why the term "arithmetic mean" is preferred for clarity. In statistics it is usually denoted with a bar, say x (read "x bar"), meaning the mean of values x1, x2 ... xn.
For example, the arithmetic mean of the set 1, 2, 3, 4, 7, 10 is 1 + 2 + 3 + 4 + 7 + 10 / 6 = 4.5 (verified using this arithmetic mean calculator). As you may note, the number 4.5 is not a part of the original set of numbers, and that is quite common. The mean is not a robust statistic, meaning that it is greatly influenced by outliers / extreme values. For example, adding the number 99 to the previous set of numbers will increase the mean from 4.5 to 18, which is significantly larger than all but one of the values in the set. In some cases, this is a desired property, while in others it makes it unsuitable for the purpose.
In some cases a "mean" or an "average" may refer to a weighted average, in which different weights are assigned to different points of the data set based on some characteristic of theirs. This mean calculator does not support weighted averages as they require a more advanced set of inputs. You can, however, use our weighted mean calculator to find the weighted average.
Arithmetic mean formula
The symbolic representation of the formula to find the average of a set is:
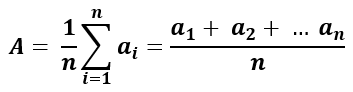
n is, of course, the number of elements in the set of data. To find the mean simply replace the values at hand in the formula and solve the simple equation. For example, if the numbers are 2, 4, and 6 their arithmetic average can be found by summing 2, 4, and 6, and then dividing them by their count (3), resulting in (2 + 4 + 6) / 3 = 12 / 3 = 4.
Examples of finding the mean
There are many problems that can be solved using the arithmetic mean formula. Some quick examples:
Example #1: Find the mean of 9 and 7. To do this, simply add the two numbers up, then divide by their count, which is two: (9 + 7) / 2 = 16 / 2 = 8. So the average of 9 and 7 is 8.
Example #2: Find the arithmetic mean of the numbers from 1 to 10. To do this, first add the numbers up, then divide by their count. (1 + 2 + 3 + 4 + 5 + 6 + 7 + 8 + 9 + 10) / 10 = 55 / 10 = 5.5. So the average of the numbers between 1 and 10 is 5.5. See this example in the calculator.
Useful properties of the arithmetic average
The properties that make the arithmetic mean useful are that the numbers to the left of the mean are balanced by the numbers to the right of the mean, in other words - the residuals, or the deviations from the estimate, sum up to zero. As a summary descriptive statistic of a given set, it has the property of minimizing the average distance between itself and each number of that set. Another way to express that is to say that it minimizes the sum of squared deviations (has the lowest root mean squared error - sum of (xi - x)2) so it serves as the single best predictor for the set.
Due to the above qualities, for samples drawn from a population (e.g. a survey) the sample mean is a statistically unbiased estimator for the population mean. These are all reasons to make use of our arithmetic average calculator.
How to not be mislead by averages
As with any single number that is used to represent a set of data, a mean is bound to be an incomplete, and in a sense inaccurate representation. Averages were widely used before the invention of computers when plotting or otherwise visualizing even moderately large sets of data was a huge task, and few people could understand the graphs. However, nowadays we have very powerful and very easy ways to show the whole set of data, the whole distribution, so presenting only the arithmetic mean may be a bad practice. See When to Use Mean, Median, or Mode for a deeper discussion on this topic.
When the mean of a set does not tell us much
Take for example these 3 sets of data, each for 17 employees from three different companies: A, B, and C:
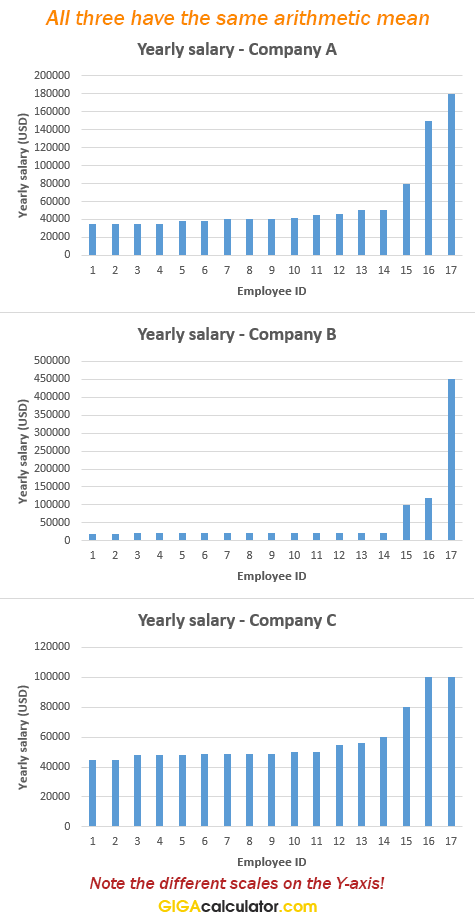
All of the above have the same arithmetic average, despite the different range and distribution. Also note that the Y-axis is not on the same scale for all three graphs. Here is the same data on the same coordinate system:
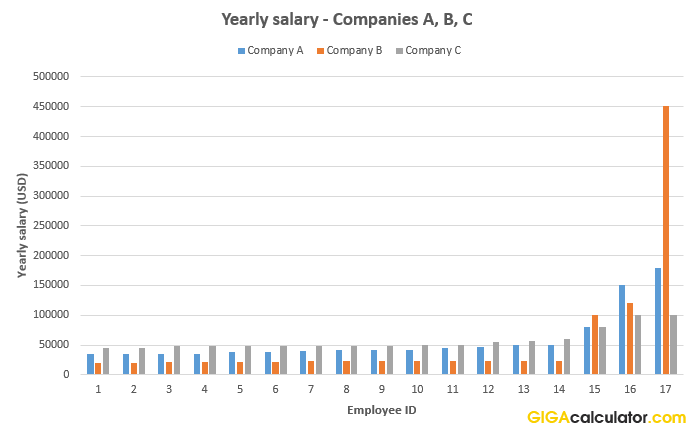
The difference in individual salaries is quite obvious, yet the mean is the same for all three companies: $57,705.88 yearly. Even in company C, which has the flattest salary distribution, 14 out of 17 employees (82%) receive less than the average. Despite this, many intuitively expect that around 50% of employees get more than $57,705 a year This stems from an unwarranted subconscious assumption that the underlying distribution is symmetrical around the mean and, usually, that it is more or less a normal distribution (Bell curve, Gaussian distribution).
When intuitions or assumptions about the symmetry or skewness of the data fail us the mean can be highly misleading so always examine the full distribution when possible.
"Average" does not mean "typical"
A lot of people seemingly fail to understand the difference between the arithmetic average and the informal use of the word "average" as a synonym to "typical". The former might actually be more closely approximated by the mode (most often seen value) or median (a value which cuts the set in two sets with equal number of members), unless discussing growth or percentage gain, or balancing an index, where the geometric or harmonic means are suitable. When looking for a "typical" value, you might want to examine a percentile, say the middle 50% or 60% or 80% and measure their arithmetic average, to get a better idea of what "typical" is.
This is why one should be very, very careful when using averages to make any kind of decision. For example, if looking to get into a particular business, one might eyeball the average salary without understanding that the distribution likely follows a power law (Paretian distribution). In such a distribution a lot of people's earnings fall below the average and a few are way above it. A textbook example is a real estate agent trying to pitch you a house in a neighborhood by saying that the average net worth of the people living there is in the tens of millions, while "forgetting" to mention that one of them is Bill Gates. While the rest of his neighbors could also be millionaires, they could be making $60,000 a year and the average could still be in the tens of millions, depending on the size of the neighborhood.
Examine the full data
Where possible, always request the full data, or at least a visual representation of the data distribution! Having the data, you can always calculate its average, either by using our arithmetic mean calculator, or Excel, or a more advanced desktop or online software. This advice is coming after years of looking at averages for all kinds of data: your best bet is to not trust the average, but seek to understand the whole dataset. The arithmetic mean works best for approximately normally-distributed data where the majority of data points are clustered around the middle, for example height in humans. When practical considerations do not allow that, ask for additional statistics, like the median and mode, the range, etc.
Averaging angles and daytimes
Special attention should be paid when averaging angles - you should be very careful when doing so, since in the geometric sense the arithmetic average of the value in degrees might be a bad descriptor of the set. E.g. the average between 5° and 355° is 180°, but a more appropriate average might be 0° as it is between the two on a circle. The preferred approach in this case may be to convert the angles to corresponding units on a point circle, e.g. α to (cosα, sinα). After converting from polar to Cartesian coordinates, compute the arithmetic mean for the points, then convert back to polar coordinate.
Similar considerations and steps could be taken for averaging day times.
Cite this calculator & page
Cite results from this online calculator or information on this page by choosing a citation format:
Georgiev, G.Z. (n.d.). Mean Calculator. GIGAcalculator.com. Retrieved Aug 01, 2026, from https://www.gigacalculator.com/calculators/mean-calculator.php