Confidence Interval Calculator
Easily calculate the confidence bounds for a one-sample statistic or a confidence interval for differences in proportions or means (two independent samples). One-sided and two-sided intervals are supported, as well as confidence intervals for relative difference (percent difference). Also computes P-value and Z-score if "difference between two groups" is selected.
- How to use the calculator
- What is a confidence interval
- Confidence interval formula
- How to interpret an interval
- Common misinterpretations of confidence intervals
- One-sided vs. two-sided intervals
- Confidence intervals for relative difference
How to use the calculator
This statistical calculator allows you to perform a post-hoc evaluation of a set of data. It works on the assumption of a normal distribution (Z-distribution) of the test statistic which should be satisfied in all but the smallest sample sizes.
The calculator allows the comparison of independent samples, as well as assessing if a sample belongs to a known population. The following scenarios are supported:
- absolute difference between two proportions (binomial data such as conversion rate or event rate)
- absolute difference between two means (continuous data, e.g. height, weight, speed, time, revenue, etc.)
- relative difference between two proportions or two means
- a confidence interval bounds around the average of a single data set
Required input
For a CI from a single group, you need to know the sample size, sample standard deviation and the sample arithmetic average.
If entering data for a CI for difference in proportions, the sample sizes of the two groups as well as the number or rate of events are needed by the calculator to calculate the confidence interval. Enter the rate as a proportion (e.g. 0.10), percentage (e.g. 10%), or raw number of events (e.g. 50).
If entering means data, make sure the tool is in "raw data" mode and simply copy/paste or type in the raw data. Each observation can be separated by a comma, space, new line, or tab. Copy-pasting from a Google or Excel spreadsheet works fine.
Calculator output
The confidence interval calculator will output the following:
- two-sided confidence interval
- left-sided and right-sided confidence bounds
- the mean or difference ± the standard error of the mean (SEM)
- sample size(s)
- Z-score (z statistic)
- p-value for the one-sided hypothesis (one-tailed test)
By default a 95% confidence interval is used to calculate confidence bounds, but the confidence level can be changed to match the required level of uncertainty.
Requirements for valid results
Have a fixed sample size or stopping time for your experiment in advance. Doing otherwise results in optional stopping. It results in intervals that have narrower coverage than the nominal.
Do not use this confidence interval calculator for comparisons of more than two means or proportions, or for comparisons of two groups based on more than one metric. If your statistical hypothesis test involves more than one treatment group or has more than one outcome variable you need a more advanced calculator which corrects for multiple comparisons and multiple testing. This statistical calculator might help.
What is a confidence interval
A confidence interval is defined by an upper and lower boundary (limit) for the value of a variable of interest. It is a tool which aids in assessing the uncertainty associated with a measurement in experimental context or in observational studies. The wider an interval is, the more uncertainty there is in the estimate.
Every interval is constructed based on a required confidence level, e.g. 0.09, 0.95, 0.99 (90%, 95%, 99%). This level corresponds to a key characteristic of confidence intervals: its coverage probability. For example, a 95% interval contains the true value of interest 95% of the time (in 95 out of 5 similar experiments).
Simple two-sided confidence intervals are symmetrical around the observed mean. This calculator also produces symmetrical bounds around the observed mean or difference of means. In scenarios such as sequential monitoring which call for more complex models to be used, interval estimates may be asymmetrical.
In any particular instance the true population parameter value may lie anywhere within the interval, or it might not be contained within it, no matter how high the confidence level is. Raising the confidence level widens the interval, while decreasing it makes it narrower. Similarly, larger sample sizes generally result in narrower confidence intervals, since an interval's asymptotic behavior is to be reduced to a single point.
Confidence interval formula
The generic formula used in any CI calculator involves the observed statistic (mean, proportion, or otherwise) plus or minus the margin of error, expressed as standard error (SE). This simple equation is the basis of any confidence interval calculation:
CIbounds = X ± SE
Different variations of the confidence procedure are required when answering specific estimation questions. It is important to use the right kind of interval, which depends on the question asked, as explained in one-tailed vs. two-tailed intervals.
Single sample interval formula
The formula when calculating a one-sample confidence interval is:
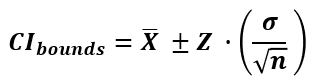
where n is the number of observations in the sample, X (read "X bar") is the arithmetic mean of the sample and σ is the sample standard deviation (&sigma2 is the variance).
Formula for a two-sample confidence interval
The formula for two-sample confidence interval for the difference of means or proportions is:
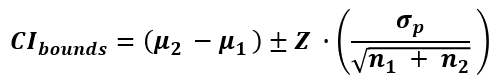
where μ1 is the mean of the baseline or control group, μ2 is the mean of the treatment group, n1 is the sample size of the baseline or control group, n2 is the sample size of the treatment group, and σp is the pooled standard deviation of the two samples. The entire expression to the right of ± is the sample estimate of the standard error of the mean (SEM) (unless the entire population has been measured, in which case there is no sampling involved in the calculation).
In both formulas Z is the score statistic, corresponding to the desired confidence level. The Z-score corresponding to a two-sided interval at level α (e.g. 0.90) is calculated for Z1-α/2, revealing that a two-sided interval, similarly to a two-sided p-value, is calculated by conjoining two one-sided interval estimate with half the error rate. E.g. a Z-score of 1.6448 is used for a 0.95 (95%) one-sided confidence interval and a 90% two-sided interval, while 1.956 is used for a 0.975 (97.5%) one-sided confidence interval and a 0.95 (95%) two-sided interval.
Our confidence interval calculator will output both one-sided bounds. It is up to the user to choose the correct one based on the inference or estimation task at hand. The adequate interval is determined by the question you are looking to answer.
Common critical values Z
Below is a table with common critical values used for constructing two-sided confidence intervals for statistics with normally-distributed errors. The values are given in number of standard deviations.
| Two-sided Confidence level | Critical value (Z) |
|---|---|
| 80% | 1.2816 |
| 90% | 1.6449 |
| 95% | 1.9600 |
| 97.5% | 2.0537 |
| 98% | 2.3263 |
| 99% | 3.0902 |
| 99.9% | 3.2905 |
For one-sided intervals, use a value for 2x the error. E.g. for a 95% one-sided interval use the critical value for a 90% two-sided interval above: 1.6449.
How to interpret an interval
Confidence intervals are useful in visualizing a range of effect sizes compatible with the data. Any value outside of the interval is rejected with the specified level of confidence. A null hypothesis which covers that parameter value would be rejected by a NHST with a significance threshold equal to the interval confidence level since the p-value statistic will be in the rejection region. Conversely, any value inside the interval cannot be rejected, thus when the null hypothesis of interest is covered by the interval it cannot be rejected.
The above essentially means that the values outside the interval are the ones we can make inferences about. For the values within the interval we can only say that they cannot be rejected given the data at hand. When assessing the effect sizes that would be refuted by the data, you can construct as many confidence limits at different confidence levels from the same set of data as you want - this is not a multiple testing issue. A better approach is to calculate the severity criterion of the null of interest, which will also allow you to make decisions about accepting the null.
Common misinterpretations of confidence intervals
Confidence intervals tend to be a bit less prone to misinterpretation than p-values. However, they still suffer from misuse and bad interpretations. Here are two of the most popular ones, according to Greenland at al. [1].
Probability statements about specific intervals
Strictly speaking, an interval computed using any CI calculator either contains or does not contain the true value. Therefore, it would be incorrect to state about a particular 99% (or any other level) confidence interval that it has 99% probability that it contains the true parameter value. What one can say is that the confidence procedure produces intervals containing the true value 99% of the time.
The reverse statement would be that there is just 1% probability that the true value is outside of the interval. This is also incorrect as it assigns probability to a hypothesis instead of viewing it as a characteristic of the confidence interval procedure. What you can say is that, if any null hypothesis not covered by the interval is true, it will fall outside of such an interval only 1% of the time. Results from this confidence interval calculator should under no circumstances be interpreted as degrees of belief.
A 95% confidence interval predicts where 95% of estimates from future studies will fall
While inexperienced research workers make this mistake, a confidence interval makes no such prediction. Usually the probability with which outcomes from future experiments fall within any specific interval is significantly lower than the interval's confidence level.
One-sided vs. two-sided intervals
While presently most researchers customarily provide confidence intervals in their two-sided form, this can be misleading or cause confusion. Such is the case when scientists are interested if a particular value below or above the interval can be excluded at a given significance level. A one-sided interval in which one boundary is plus or minus infinity is appropriate when making statements about a value lying either above or below the top / bottom limit. A two-sided interval can be seen as the overlap between two one-sided intervals at 1/2 the error rate 2.
For example, if the calculator produced the two-sided 90% interval (2.5, 10), we can actually say that values less than 2.5 are excluded with 95% confidence precisely because a 90% two-sided interval is nothing more than two conjoined 95% one-sided intervals:
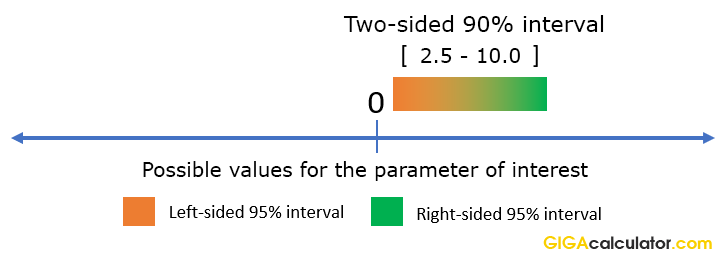
Therefore, to make directional statements based on two-sided intervals, one needs to increase the confidence level for the statement. In such cases it is better to use the appropriate one-sided interval instead.
Confidence intervals for relative difference
When comparing two independent groups with a variable of interest being the relative difference (a.k.a. relative change, percent change, percentage difference) different confidence intervals need to be constructed from when one is interested in the absolute difference between the two means or proportions. This is due to the fact that to calculate relative difference involves an additional division by the conversion rate of the control during the experiment. It is a random variable and the division by it adds more variance.
The formula for a confidence interval around the relative difference (percent effect) is [4]:
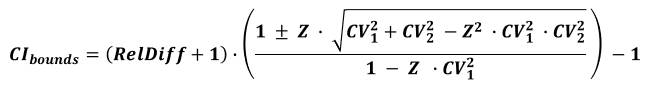
where RelDiff is calculated as (μ2 / μ1 - 1), CV1 is the coefficient of variation for the control and CV2 is the coefficient of variation for the treatment group, while Z is the critical value expressed as standardized score. Selecting "relative difference" in the calculator interface switches it to using this equation.
In simulations performed [3] with the formulas used in this confidence interval calculator, the naive extrapolation of an interval with 95% coverage for absolute difference had coverage for the relative difference between 90% and 94.8% depending on the size of the true difference. It had anywhere from a couple of percentage points to over two times worse coverage than its nominal level. A properly constructed 95% confidence interval for relative difference had coverage of about 95%.
References
Cite this calculator & page
Cite results from this online calculator or information on this page by choosing a citation format:
Georgiev, G.Z. (n.d.). Confidence Interval Calculator. GIGAcalculator.com. Retrieved Jul 10, 2026, from https://www.gigacalculator.com/calculators/confidence-interval-calculator.php
Our statistical calculators are featured in 400+ scientific papers (Google Scholar ) published in high-profile science journals by:


The author of this tool
 Georgi Georgiev is an applied statistician with background in statistical analysis of online controlled experiments, including developing statistical software, writing over one hundred articles and papers, as well as the influential book "Statistical Methods in Online A/B Testing".