Hazard Ratio Calculator
Use this hazard ratio calculator to easily calculate the relative hazard, confidence intervals and p-values for the hazard ratio (HR) between an exposed/treatment and control group. One and two-sided confidence intervals are reported, as well as Z-scores based on the log-rank test.
- Using the hazard ratio calculator
- What is a hazard ratio (relative hazard)
- How to interpret a hazard ratio
- Hazard ratio vs. Risk Ratio (Relative Risk)
- Standard error and confidence interval formula
- One-sided vs. two-sided intervals
Using the hazard ratio calculator
This calculator allows you to perform a post-hoc statistical evaluation of time to event data when the outcome of interest is the change in the average hazard ratio (abbr. HR, a.k.a. relative hazard or RH) between an exposed/treatment group and a control group.
The tool only has one input field for your raw data and one to specify the confidence level for your confidence interval. You need to follow an exact order of columns in order for the tool to work as expected: Column 1: time (number of days, weeks, months, years, etc.), Column 2: events in treatment group, Column 3: number at risk in treatment group, Column 4: events in control group, Column 5: number at risk in the control group. Risk might not make sense in some instances, e.g. if your research aims to improve pregnancy rates then the events in the control group can be live births while "number at risk" is actually the couples still trying to get to that stage who have not dropped from the study for other reasons. Note that the number at risk should contain the number who were at risk at the beginning of the period, minus the censored observations. If there is censored data, it should be reflected by decreasing the number at risk, as shown in the example, e.g. at week #6 there is one censored observation in group A.
Here is example input - first how it seems in a spreadsheet and then how it looks when the data is copied to our calculator:
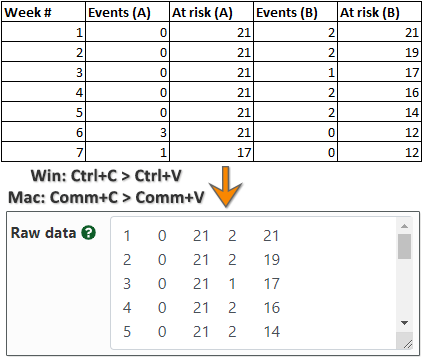
Click here to load the example data into the calculator and see the output. Make sure you exclude any column headers and that each row should contain exactly 5 values, separated by commas, spaces or tabs. Use dot as a decimal notation. If there is censored data, it should be reflected by decreasing the number at risk, as shown in the example, e.g. at week #6 there is one censored observation in group A.
The hazard ratio calculator will output: hazard ratio, two-sided confidence interval, left-sided and right-sided confidence interval, two-sided p-value and Χ2 statistic. It will also plot time to event curves, a.k.a. survival curves.
What is a hazard ratio (relative hazard)
The hazard ratio quantifies the difference between the hazard of two groups and it is calculated as the ratio between the ratios of observed events and expected events under the null hypothesis of no difference between the two groups. It is equivalent to the risk ratio when viewed within a time slice, so one can say it is the instantaneous risk ratio. Most often what is computed in research papers is the mean hazard ratio across all time slices, which reflects the differences in two survival curves.
The average hazard ratio is an appropriate statistic when what we are interested in is a comparison of the relative time to event rate, which is what the HR reflects. If we denote the observed event rate in group A at time t as ObsA, the expected event rate at time t as ExpA, the observed event rate in group B at time t as ObsB and the expected event rate in group B at time t as ExpB, then the formula is [1]:
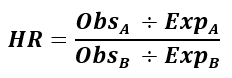
This is the math equation used in this hazard ratio (HR) calculator. The formula for the mean hazard ratio is the same, but instead of observed and expected at time t, we sum the observations and expected observations across all time slices.
From this we can see why the hazard ratio is also called the relative failure rate or relative event rate. Another way to describe the overall hazard ratio is as the geometric mean of piecewise hazard ratios (ratios per unit time), weighted proportional to the number of events per period. The results from this simple calculation are very close to or identical with results from the more complex Cox proportional hazard regression model which is applicable when we want to take into account other confounding variables.
In this software we use the log-rank test to calculate the Χ2 statistics, the p-value, and the confidence intervals. It is sometimes wrongly assumed that both the log-rank test and the Cox regression rely on an assumption of proportional hazards between the control and treatment group(s), but this is not so, and the statistic remains a good measure for the differences between groups even if the hazard ratio is changing over time. It is true, however, that both methods achieve greatest statistical power when the hazard is proportional across time slices.
How to interpret a hazard ratio
In many medical, epidemiological and economic analyses you can see an average hazard ratio for the difference between two groups being reported. Average in the sense that it is averaged across all time slices. An average hazard ratio of 1 indicates no difference in survival rates / event rate over time between the two groups being compared, on average. If the hazard ratio is larger than 1 it means an increased risk of an event across all time points, on average, while if it is less than 1 there is a reduction in that same risk. If instead of risk you are measuring positive events like recovery from illness then the reverse is true: an HR greater than 1 means increased likelihood for a positive event while a value less than 1 means decreased likelihood. Note that this assumes the treatment/intervention group is compared to the control group. If you perform the reverse comparison, the reverse of these statements are true.
If our hazard ratio calculator outputs a ratio of 0.5, it means that on average, a subject in the treatment group is half as likely to experience an event than a subject from the control group, given they both reached a given point in time t. In other words, HR is equivalent to the relative risk that an individual in the group with the higher hazard reaches the endpoint first [2] (with correction: odds replaced with risk), equivalently: that an individual in the group with the lower hazard reaches the endpoint last. It, however, does not mean that at all points in time a subject in the treated group has twice the survival risk or even twice the chance to experience an event - as with any other average, it cannot be interpreted in reverse - as applying to all elements of the class from which it was calculated.
It should be noted that two time to event curves with the same hazard ratio may in fact lead to vastly different practical outcomes. Take for example the following two comparisons which result in the same hazard ratio of 0.5, but vastly different differences in medians and (restricted) means:
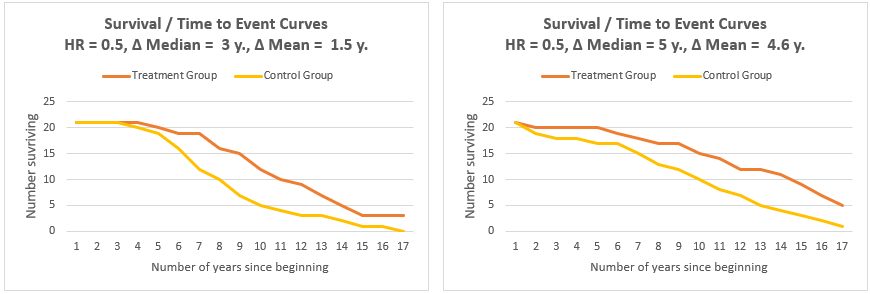
This is an illustration of the side-effect of the fact that HR is based on relative rankings and not on actual survival times. Additional metrics such as the median and mean or restricted mean need to be considered as well as visual representation which would depict the actual survival curves. Using these additional tools it is easy to spot that the graph on the right depicts significantly better performance than the one on the left. This is not something you can currently accomplish with our tool.
Hazard ratio vs. Risk Ratio (Relative Risk)
Despite often being mistaken for being the same thing, relative risk and hazard ratios are nothing alike [3,4]. To give an extreme example, the relative risk at time tend when all patients in a cancer trial have died through one cause or another will be 1, while the hazard ratio may be any number from 0 to plus infinity, depending on the actual survival curves. The relative risk (RR) at any point t is a decreasing function of t with a value equal to 1 - HR only at t=0 [3,4].
The hazard ratio indicates a reduction of hazard which is a reduction in the rate of the event, not the chances of it happening. The latter is what relative risk measures and which would be the metric of interest if durable benefit is what you want to measure.
Standard error and confidence interval formula
The standard error of the log hazard ratio can be approximated with:
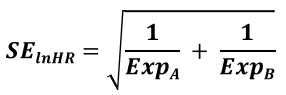
Accordingly, confidence intervals in our hazard ratio calculator are calculated using the formula:
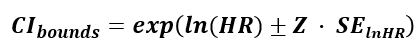
where HR is the calculated hazard ratio (relative hazard), SElnHR is the standard error for the log hazard ratio and Z is the score statistic, corresponding to the desired confidence level. The Z-score corresponding to a two-sided interval at level α (e.g. 0.90) is calculated for Z1-α/2, revealing that a two-sided interval, similarly to a two-sided p-value, is calculated by conjoining two one-sided intervals with half the error rate. E.g. a Z-score of 1.6448 is used for a 0.95 (95%) one-sided confidence interval and a 90% two-sided interval, while 1.956 is used for a 0.975 (97.5%) one-sided confidence interval and a 0.95 (95%) two-sided interval. Therefore it is important to use the right kind of interval: see below for more on this.
One-sided vs. two-sided intervals
While confidence intervals are customarily given in their two-sided form, this can often be misleading if we are interested if a particular value below or above the interval can be excluded at a given significance level. A one-sided hazard ratio interval in which one side is plus or minus infinity is appropriate when we have a null / want to make statements about a hazard ratio value lying either above or below the top / bottom bound [5]. By design a two-sided hazard ratio interval is constructed as the overlap between two one-sided intervals at 1/2 the error rate 2.
For example, if we have the two-sided 90% interval with hazard ratio limits (2.5, 10), we can actually say that hazard ratios less than 2.5 are excluded with 95% confidence precisely because a 90% two-sided interval is nothing more than two conjoined 95% one-sided intervals:
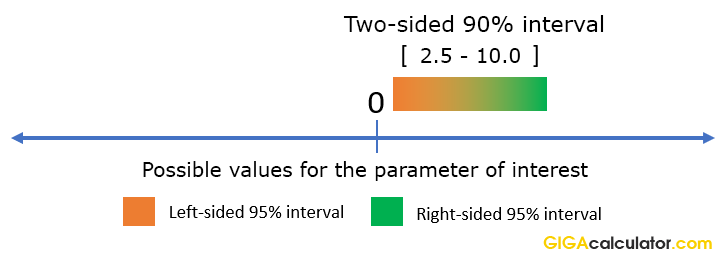
Therefore, to make directional statements about hazard ratios based on two-sided intervals, one needs to increase the significance level for the statement. In such cases it is better to use the appropriate one-sided interval instead, to avoid confusion. Conveniently, our calculator outputs this for you automatically.
References
1Altman D.G., (1991). "Practical Statistics for Medical Research". London, Chapman and Hall
Cite this calculator & page
Cite results from this online calculator or information on this page by choosing a citation format:
Georgiev, G.Z. (n.d.). Hazard Ratio Calculator. GIGAcalculator.com. Retrieved Jul 30, 2026, from https://www.gigacalculator.com/calculators/hazard-ratio-calculator.php
Our statistical calculators are featured in 400+ scientific papers (Google Scholar ) published in high-profile science journals by:


The author of this tool
 Georgi Georgiev is an applied statistician with background in statistical analysis of online controlled experiments, including developing statistical software, writing over one hundred articles and papers, as well as the influential book "Statistical Methods in Online A/B Testing".