P-value Calculator
Statistical significance calculator to easily calculate the p-value and determine whether the difference between two proportions or means (independent groups) is statistically significant. T-test calculator & z-test calculator to compute the Z-score or T-score for inference about absolute or relative difference (percentage change, percent effect). Suitable for analysis of simple A/B tests.
- How to use the p-value calculator
- What is "p-value" and "significance level"
- P-value formula
- Why do we need a p-value?
- How to interpret a statistically significant result
- P-values for relative difference in means or proportions
How to use the p-value calculator
This statistical significance calculator allows you to perform a post-hoc statistical evaluation for difference of two proportions (binomial data, e.g. conversion rate or event rate) or for difference of two means (continuous data such as height, weight, speed, time, revenue, etc.). The output is the observed significance level (p-value statistic) and other statistics.
Which statistical test to use
In general, use the Z-test if the statistic follows a normal distribution and a T-test if it is T-distributed. Because of the Central Limit Theorem, the normal distribution of the statistic is typically safe to assume for sample sizes above thirty per group, except in cases of extreme skewness of the raw data distribution [6].
The Student's T-test is recommended mostly for very small sample sizes, such as when the number of values is less than thirty (n < 30). To avoid type I error inflation which might occur with unequal variances, the calculator automatically applies the Welch's T-test instead of Student's T-test if the sample sizes differ significantly. It also does so if one set has less than 30 values and the sampling ratio is different than one.
Types of input data
- For proportions data, you need to know the sample sizes of the two groups as well as the number or rate of events. These can be entered as proportions (e.g. 0.10), percentages (e.g. 10%) or just raw numbers of events (e.g. 50).
- If entering other means data, simply copy/paste or type in the raw data, each observation separated by comma, space, new line or tab. Copy-pasting from a Google or Excel spreadsheet works fine.
Calculator output
The p-value calculator will output:
- p-value (e.g. 0.01)
- significance level (e.g. 99%)
- T-score or Z-score (depending on the choice of test statistic)
- degrees of freedom
- the observed difference in means or proportions
For means data it will also output the sample sizes, means, and the pooled standard error of the mean (SEM).
The resulting p-value is for a one-sided hypothesis (one-tailed test). This has the most practical applications and allows a researcher to infer the direction of the effect (more on one vs. two-tailed tests). The probability value for a two-sided hypothesis (two-tailed p-value) is also calculated and displayed for reference, even though it should have little to no practical applications.
Requirements for valid results
You must have fixed the sample size or stopping time of your experiment in advance. Otherwise it will be subject to optional stopping. This makes it incompatible with the statistical model used in fixed-horizon statistical tests. The result is an inflated actual type I error versus what is being calculated which renders any p-value unusable for statistical significance testing.
Do not use this significance calculator for comparisons of more than two means or proportions or for comparing two groups based on more than one metric. If a hypothesis test involves more than one treatment group or more than one outcome variable you need to apply corrections for multiple comparisons and/or multiple testing. For such cases, consider this advanced statistical calculator.
What is "p-value" and "significance level"
The p-value is a heavily used test statistic that quantifies the uncertainty of a given measurement under a specified test hypothesis (a.k.a null hypothesis). It is often used by researchers and in scientific experiments, medical trials, and various observational studies. The p-value is inseparable from the Null-Hypothesis Statistical Test (NHST) since this is where the null hypothesis is defined. It specifies a statistical model one does not want to dismiss without solid evidence against it. Typically, an alternative hypothesis is specified which exhausts all other possibilities.
For example, the test hypothesis could be that exposure to ultraviolet light for prolonged periods of time has positive or neutral effects regarding developing skin cancer. In this case the alternative hypothesis is that it has a negative effect on development of skin cancer.
P-value definition
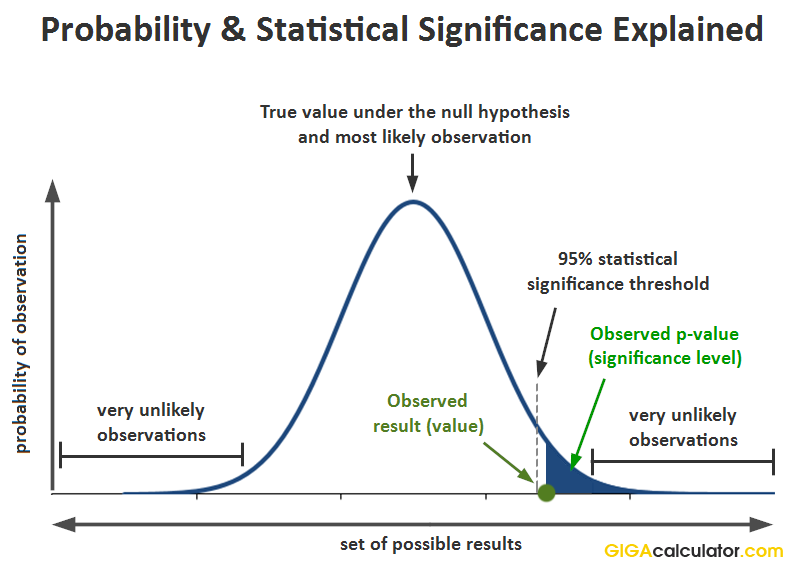
In the NHST framework, a p-value is defined as the probability of observing the result which was observed, or a more extreme one, assuming the null hypothesis is true. In notation this is expressed as:
p(x0) = Pr(d(X) > d(x0); H0)
where x0 is the observed data (x1,x2...xn), d is a special function (statistic, e.g. calculating a Z-score), and X is a random sample (X1,X2...Xn) from the sampling distribution of the null hypothesis. This equation is used in this p-value calculator and can be visualized as such:
Relation to type I errors and standard deviation
In statistical testing, the p-value is the probability of committing a type I error. This error consists of rejecting a null hypothesis when it is in fact true. See interpretation of the p-value statistic below.
Another way to think of a p-value is as a user-friendly expression of how many standard deviations away from the expected under the null hypothesis a given observation is. It is expressed in a standardized way for a standard normal distribution. For example, in a one-tailed test of significance for a normally-distributed variable, a result 1.6448 standard deviations away (1.6448σ) translates to a p-value of 0.05, so the probability of observing it is five percent.
P-value and statistical significance
In statistical inference, the term "statistical significance" or "significance level" is often used in conjunction with the p-value. It requires the specification of a threshold which, if crossed, means the result is "statistically significant". It can be expressed in percentages, for example the level of significance is (1 - p value) so a p-value of 0.05 is equivalent to a significance level of 95% (1 - 0.05 * 100). In scientific contexts the significance threshold is sometimes expressed as a T-score or Z-score. For example, a result would be considered statistically significant only if the Z-score is in the critical region above 1.96. This is equivalent to a threshold of 0.025.
P-value formula
There are different ways to arrive at a p-value depending on assumptions about the distribution of the test statistic. This tool supports two such distributions: the Student's T-distribution and the normal Z-distribution (Gaussian) resulting in a T test and a Z test, respectively.
In both cases, to find the p-value requires estimating the variance and standard deviation. From these, the standard error of the mean is derived. Finally, a standard score is calculated using the formula [2]:
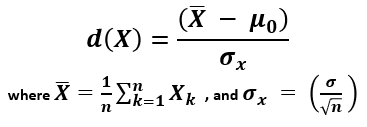
X (read "X bar") is the arithmetic mean of the population baseline or the control, μ0 is the observed mean / treatment group mean, while σx is the standard error of the mean (SEM, or standard deviation of the error of the mean).
When calculating a p-value using the Z-distribution the formula is Φ(Z) or Φ(-Z) for lower and upper-tailed tests, respectively. Φ is the standard normal cumulative distribution function and a Z-score is computed. In this mode the tool functions as a Z score calculator.
When using the T-distribution the formula is Tn(Z) or Tn(-Z) for lower and upper-tailed tests, respectively. Tn is the cumulative distribution function for a T-distribution with n degrees of freedom and so a T-score is computed. Selecting this mode makes the tool behave as a T test calculator.
The population standard deviation is often unknown and it has to be estimated from the samples. Knowing or estimating the standard deviation is a prerequisite for using a significance calculator.
Why do we need a p-value?
In the sciences, a p-value is often a requirement for publication by scientific journals. In business experiments (e.g. A/B testing) it is reported alongside confidence intervals and other estimates. A deeper understanding of its utility may help appreciate it's widespread use.
The problem a p-value solves is that people need to share information about the evidential strength of data relative to a hypothesis. It should be easy to understand and to compare across experiments. The picture below represents, albeit imperfectly, the results of two simple experiments. They both end up with a 10% event rate in the control group, and 12% event rate in the treatment group.

However, it is obvious that the evidential input of the data is not the same. Communicating just the observed proportions or their difference (effect size) is not enough to communicate what the data shows. In order to fully describe the evidence and associated uncertainty, several statistics need to be communicated. At minimum, these are:
- sample size
- sample proportions
- the shape of the error distribution
Their interaction is not trivial to understand, so communicating them separately makes it very difficult to grasp what information is present in the data. For example, what would you infer if you are told that the observed proportions are 0.1 and 0.12 (e.g. conversion rate of 10% and 12%), the sample sizes are 10,000 users each, and the error distribution is binomial?
Instead of communicating several statistics, the p-value combines the information from the above descriptive statistics into a single test statistic which shows the probability of observing such an extreme outcome, or a more extreme one, under the null hypothesis. It was first derived in the late 18-th century by Pierre-Simon Laplace when he observed data about a million births that showed an excess of boys, compared to girls. Using the calculation of significance he argued that the effect was real but unexplained at the time. We now know this to be true and there are several explanations for the phenomena coming from evolutionary biology.
Statistical significance calculations were formally introduced in the early 20-th century by Pearson and popularized by Sir Ronald Fisher in his work, most notably "The Design of Experiments" (1935) [1] in which p-values were featured extensively. In business settings significance levels and p-values see widespread use in process control and various business experiments (such as online A/B tests, i.e. as part of conversion rate optimization, marketing optimization, etc.).
How to interpret a statistically significant result
Saying that a result is statistically significant means we observed a low p-value which is below the evidential threshold chosen before the statistical test was performed. If the chosen probability threshold is 0.05, observing a p-value of 0.025 would mean that the result is interpreted as statistically significant.
But what does that really mean? What inference can we make from seeing a result which was quite improbable if the null hypothesis was true?
Observing any given low p-value can mean one of three things [3]:
- There is a true effect from the tested treatment or intervention.
- There is no true effect, but we happened to observe a rare outcome. The lower the p-value, the rarer (less likely, less probable) the outcome.
- The statistical model is invalid (does not reflect reality).
One can't simply jump to conclusion 1.) and claim it with one hundred percent certainty. This would go against the whole idea of the p-value and statistical significance. In order to use p-values as a part of a decision process external factors part of the experimental design process need to be considered which includes deciding on the significance level (threshold), sample size and power (power analysis), and the expected effect size, among other things. If you are happy going forward with this much (or this little) uncertainty as is indicated by the p-value calculation suggests, then you have some quantifiable guarantees related to the effect and future performance of whatever you are testing, e.g. the efficacy of a vaccine or the conversion rate of an online shopping cart.
Incorrect interpretations
Note that it is incorrect to state that a Z-score or a p-value obtained from any statistical significance calculator tells how likely it is that the observation is "due to chance" or conversely - how unlikely it is to observe such an outcome due to "chance alone". P-values are calculated under specified statistical models hence 'chance' can be used only in reference to that specific data generating mechanism and has a technical meaning quite different from the colloquial one. For a deeper take on meaning and interpretation, including common misinterpretations, see: definition and interpretation of the p-value in statistics.
P-values for relative difference in means or proportions
When comparing two independent groups, and the variable of interest is the relative (a.k.a. relative change, relative difference, percent change, percentage difference), as opposed to the absolute difference between the two means or proportions, the standard deviation of the variable is different which compels a different way of calculating p-values [5]. The need for a different statistical test is due to the fact that calculating relative difference involves performing an additional division by a random variable: the event rate of the control during the experiment. This adds more variance to the estimation and the resulting p-value is usually higher so the result will be less statistically significant. P-values from a statistical hypothesis test for absolute difference in means would report a lower p-value than the actual.
In simulations I have performed the difference in p-values was about 50% of nominal. For example, a given absolute difference with a p-value of 0.05 resulted in a p-value of 0.075 when the probability of the corresponding relative difference was calculated. Switching from absolute to relative difference requires a different statistical hypothesis test in order to report a correct probability. With this statistical significance calculator you can avoid the mistake of using the wrong test simply by indicating the inference you want to make.
References
1Fisher R.A. (1935). "The Design of Experiments". Edinburgh: Oliver & Boyd
2Mayo D.G., Spanos A. (2010). "Error Statistics", in P. S. Bandyopadhyay & M. R. Forster (Eds.), Philosophy of Statistics, (7, 152–198). Handbook of the Philosophy of Science. The Netherlands: Elsevier.
Cite this calculator & page
Cite results from this online calculator or information on this page by choosing a citation format:
Georgiev, G.Z. (n.d.). P-value Calculator. GIGAcalculator.com. Retrieved Jul 01, 2026, from https://www.gigacalculator.com/calculators/p-value-significance-calculator.php
Our statistical calculators are featured in 400+ scientific papers (Google Scholar ) published in high-profile science journals by:


The author of this tool
 Georgi Georgiev is an applied statistician with background in statistical analysis of online controlled experiments, including developing statistical software, writing over one hundred articles and papers, as well as the influential book "Statistical Methods in Online A/B Testing".