P-value to Z-score Calculator
Use this P to Z calculator to easily convert P-values to Z-scores (standard scores) and see if a result is statistically significant. Supports one-tailed and two-tailed p-values. Detailed information about what a Z-score is.
Using the p-value to z-score calculator
If you have a p-value statistic for a given set of data and want to convert it to its corresponding Z score this P to Z calculator will help you accomplish that. Simply enter the P-value and choose whether it was computed for a one-tailed or two-tailed significance test to calculate the corresponding Z score using the inverse normal cumulative PDF (probability density function of the normal distribution). If you have made a directional inference, saying something about the sign or direction of the effect, then your p-value should have been calculated as one-tailed, corresponding to a one-sided composite null hypothesis. If the direction of the effect did not matter in the initial p-value calculation, select two-tailed, which corresponds to a point null hypothesis.
Since the normal distribution is symmetrical, it does not matter if you are computing a left-tailed or right-tailed p-value: just select one-tailed and you will get the correct result for the direction in which the observed effect is. If you want the Z score for the other tail of the distribution, just reverse its sign, e.g. 1.7 becomes -1.7.
What is a "Z score"
The Z-score is a statistic showing how many standard deviations away from the normal, usually the mean, a given observation is. It is often called just a standard score, z-value, normal score, and standardized variable.
The standard score is calculated by estimating the variance and standard deviation, then deriving the standard error of the mean, after which a standard score is calculated using the formula [1]:
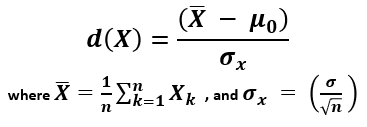
X (read "X bar") is the arithmetic mean of the population baseline or the control, μ0 is the observed mean / treatment group mean, while σx is the standard error of the mean (SEM, or standard deviation of the error of the mean).
The interpretation of a Z-score has problems similar to that of p-values and confidence intervals, on which you can read more in our respective pages.
One of the applications of standard scores is in constructing prediction intervals. A prediction interval [L,U] is an interval such that a future observation X will lie in the interval with a given probability, i.e. 90%.
P value to Z-score conversion table
Below are some commonly encountered p-values and their corresponding standard scores, assuming a one-tailed hypothesis.
| Percentile | P-value | Standard score (Z) |
|---|---|---|
| 80% | 0.2000 | 0.8416 |
| 90% | 0.1000 | 1.2816 |
| 95% | 0.0500 | 1.6449 |
| 97.5% | 0.0250 | 1.9600 |
| 98% | 0.0200 | 2.0537 |
| 99% | 0.0100 | 2.3263 |
| 99.9% | 0.0010 | 3.0902 |
| 99.95% | 0.0005 | 3.2905 |
References
1Mayo D.G., Spanos A. (2010). "Error Statistics", in P. S. Bandyopadhyay & M. R. Forster (Eds.), Philosophy of Statistics, (7, 152–198). Handbook of the Philosophy of Science. The Netherlands: Elsevier.
2Spanos A. (2019). "Probability Theory and Statistical Inference". Cambridge University Press. pp. 396-404, doi: 10.1017/9781316882825
Cite this calculator & page
Cite results from this online calculator or information on this page by choosing a citation format:
Georgiev, G.Z. (n.d.). P-value to Z-score Calculator. GIGAcalculator.com. Retrieved Aug 01, 2026, from https://www.gigacalculator.com/calculators/p-value-to-z-score-calculator.php
Our statistical calculators are featured in 400+ scientific papers (Google Scholar ) published in high-profile science journals by:


The author of this tool
 Georgi Georgiev is an applied statistician with background in statistical analysis of online controlled experiments, including developing statistical software, writing over one hundred articles and papers, as well as the influential book "Statistical Methods in Online A/B Testing".